Monday, April 30, 2012

USDCAD update

As seems evident the previously held diagonal count was violated, however that has not changed my stance on this currency pair. As of the evidence obtained from the recent market action, the USD/CAD appears to be on the verge of a major turn to the upside.

Posted above is a 2 day chart with compressed Elliott wave labels, As seems evident from above the momentum of the declines into the 2011 has lost steam which is reflected by the obvious divergence on the MACD indicator. Another important point to note on the MACD is that we have a potential Zero line reversal signal in the making. The MACD zero line usually acts as support for counter trend moves (decline from OCT 2011). Also notice the inverse head and shoulders pattern highlighted above. The range from the head to the neckline is 1300 pips, which would be our measuring tool at a break of the neckline visible above.

Above is a COT chart of the CAD futures, the commercial NET short CAD positions was at an all time high in 2011 which suggests that the 2011 peak in the Canadian dollar is probably more important than any seen since the early 90s

Above is a more detailed look of the decline from OCT 2011, it seems evident that the declines have unfolded into a double zigzag pattern, notice the divergence seen between wave W & wave Y.

Posted above is a more detailed look on the second zigzag (wave Y) wave A subdivided into an impulse and wave C took the form of an impulse with an extended first wave (the extended first wave ended In a failure fifth).


Notice the double divergence formed on the awesome oscillator.
ALT count: 1-2-3-4? from wave x (circle) high, this count suggests that the wave A of Y is still not complete
Regards,
Ahmed Farghaly

EDIT: The chart bellow is the more appropriate count.

Saturday, April 21, 2012

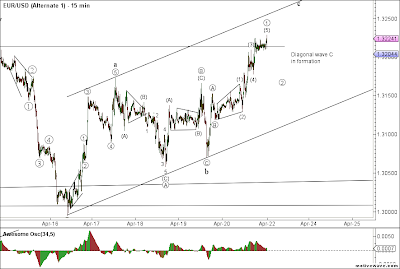
EUR/USD, USD/CHF & USD/RUB

Count 1

I prefer the count above the most, However I wouldn't be aggressive about it. Another ALT count would be that we are forming a diagonal from the low (on USD/CHF as well) with wave 1-2-3 complete, I don't like that count due to the larger pattern in perspective & due to the wave 2 that unfolded as a flat, A 'rule' of a diagonal triangle is that wave 2 & 4 must be zigzags, however experience has taught me that its better to keep my mind open
Count 2
I don't like this count as much as I like the previous one due to the wave a impulse not adhering to some guidelines one would expect about impulse waves and the internal structure is subject to debate, but it pays to keep an open mind.
Count 3
The last chart posted above once again is one of my alternates
Above is my preferred count.

ALT on CHF: Similar to the EUR/USD (Count 3) Alternate diagonal wave C in formation.
All the following charts support that the USD is setting stage for an exceptional rally soon.

Regards,
Ahmed Farghaly

S&P Fibonacci time analysis

 
Regards,
Ahmed Farghaly

Friday, April 20, 2012

EUR/USD


This count supports the idea of a corrective decline for a wave 'e' of the triangle wave X and another zigzag higher for a wave Y to around the terminus of the 4th wave of smaller degree, This interpretation complements (But does not guarantee) the ending diagonal count presented for the sterling (presented as an alternate in the last post) with two corrective waves to come, wave iv and wave v (zigzag), The bounce from the lows on the EUR seems corrective however it doesn't seem to be complete, I would wait for another push higher before considering shorting this pair, also watch the key levels on the GBP/USD mentioned on the previous post. I'm long the USDCAD at the breach of the key level on the previous post with a stop bellow the diagonal low.

Regards,
Ahmed Farghaly

Here is a copy of the GBP/USD diagonal count watch the key levels.

Thursday, April 19, 2012

USD/CAD failure fifth?

It looks like we got a failure fifth, which strengthens this being a wave C decline.

Wednesday, April 18, 2012

USD/CAD count update


Prices behaved as expected on the previous post on this currency pair, if the diagonal count is going to hold, prices need not breach the invalidation point which is at 0.98435 The risk to reward is exceptional at current levels. If it breaks lower I will re-evaluate.

Regards,
Ahmed Farghaly

USD/JPY

Above is my preferred count from last year's low it seems evident that wave 4 is complete, notice how we came back into the 4th wave of smaller degree, and right into the upper boundary line of the base channel which sometimes tends to be the limit for 4th wave corrections. wave 4 & 2 both alternate in time. ALT: 1-2-i-ii

Here is the wave 4 in greater detail, it seems evident that the decline unfolded into a zigzag correction with a typical wave relationship in which wave C=A. Notice the divergence between the end of wave A and the end of wave C, Also remember that we are right between the 38.2%-50% of wave 3 which are typical targets for a 4th wave decline. Prices have breached the level labeled "Key level" on the previous post, and is most likely on its way to breach the critical level (Please review previous posts on this currency pair http://competent-trades.blogspot.com/2012/04/usdjpy-elliott-wave-counts.html & http://competent-trades.blogspot.com/2012/04/usdjpy.html)

Regards,
Ahmed Farghaly

Tuesday, April 17, 2012

EUR/USD

Regards,
Ahmed Farghaly

USD/CAD Top down analysis

Visible bellow are my weekly chart counts on the USD/CAD both are bullish due to the 5 wave advance seen beginning on AUG of last year.


As seems evident on the chart above, we have a complete double zigzag correction to the downside, I say complete due to the 5 wave rally seen on the USD accross the board in 2011, followed by what seems to be a 'clearly' corrective set back, One of the low probability bearish alternates would be that we are forming a triangle X wave (wave (1) being a corrective wave A and (2) wave B) and we'll eventually break out and decline in a wave Z zigzag, Looking at all the markets across the board there seems to be very little reason to even hold such a count as an alternate. Lets take a look at shorter counts on this currency pair.

As visible above I am counting the advance from aug 2011 as an impulse with an extended first wave. Extended first waves are only expected to form 5 % of the time in impule waves however the odds of a first wave extention increases if the wave being analyzed in itself is a first wave due to the guideline that states that the extention in an impulse is usually the same number as its parent wave. Notice that we formed a triangle wave B (nicely confirmed by the oscillator) which signals that the move that followed (wave C) is the last move of the triangle's degree and the upcoming bounce will be at least of the same degree as the entire decline from the wave (1) peak. Also notice that we made it right into the second wave zone of smaller degree. Which is what you'd expect after a first wave extention and especially if the decline post the impulse that sported an extended first is a second wave which it is. Also notice that we declined right into the 61.8% fib of the 1st wave advance which is also a typicall target for second waves.

This hourly chart supports the idea that we are still in the second wave post the diagonal triangle that occured after this pair put in its wave (2) low as visible on the charts above. This count suggests a decline bellow 0.99 before exploding higher, Alternate count on this hourly is that the wave ii post the diagonal is complete. no shorts would be advised as the declines will prove corrective relative to the diagonal post the wave (2) low hence longs would be savvier if prices break 0.99 with a stop bellow the diagonal low.

Regards,
Ahmed Farghaly.

Monday, April 16, 2012

Even China is bullish on the US dollar

I recently heard on televesion that the chinese increased the percentage amount of the daily fluctuations they allow on thier currency from 0.5% a day to 1% a day. Consider that the government is trying to avoid a 'hard landing' and a weaker currency will help stimulate the economy considering that china is an exporting nation. Hence I dont believe they would increase the daily fluctuation percentage unless they believed that it would work in thier favor, making the yuan cheaper faster than it got expensive (back when 0.5% was the daily fluctuation limit)

Regards,
Ahmed Farghaly

USD/RUB update


This chart just updates the post that pointed the bottom on this pair(http://competent-trades.blogspot.com/2012/04/collapse-of-russia.html), as of now it seems like prices are begining to advance in a 3rd wave.

Regards,
Ahmed Farghaly

ALT: Still in a wave ii correction however the low formed late march should not be breached.

Saturday, April 14, 2012

S&P 500 & AUD/USD updates

Above is my preferred count on this market, notice how the decline seen recently is of greatest momentum since the impulse started in December last year, which is an early signal that the move is of larger degree rather than part of or the wave 4 correction as per my alternate count presented bellow. The horizontal lines are targets for the third wave (1.618x wave (i) & 2.618x wave (i) respectively). What occurred on the oscillator is very interesting, I once heard analyst Jeffery Kennedy state that he noticed that in a rising market (also applies to falling markets) when divergence occurs between price and the oscillator and prices don't follow through as one would expect by selling off substantially, sometimes a rise to a higher peak on the oscillator occurs to form what looks like a 'V' as illustrated above, only then prices follow through and behave as one would have anticipated from the initial divergence.

Now lets take a look at the AUD/USD currency pair as it has proven to be one of the most sensitive currency pairs to risk, as evident by the overlay chart presented bellow

I have 2 primary counts on the AUD/USD, Presented bellow is the count that fits into the picture of the general USD bias. However I will also discuss what this count doesnt have going for it.
The sole thing thats making me doubt this interpretation is how strongly we've rallied and broke the baseline (0-2) of this count. Usually the baseline caps all of the wave 3 price action which is not the case in this count, another point to note is the deep percentage retracement of the second wave of smaller degree, although typical after leading diagonals, a guideline of extentions states that the smaller second waves usually tend to make smaller percentage retracements than the second waves of larger degree. The April 3rd high (second day of the trading month) has not been broken as of now due to the idea presented several times on this blog with regards to financial markets remembering thier 'firsts'. Not only do they usually make thier highs/lows in the first few days of the month but the range of the bar (April 3rd in this case) acts as resistance/support (resistance in this case) notice that we made it into that range and sold off significantly. The bounce is a zigzag as of now a break bellow the diagonal low would confirm this count.
IMPORTANT NOTE: If preferred count is to prove accurate prices need to COLLAPSE soon not only do we have a series of 1-2s we also have a leading diagonal which usually signals an extended & volatile third wave to come.

The count above is my alternate, based on my horizontal analysis in terms of risky assets and other USD currency pairs it still remains the lower probability outcome. A break bellow the 0.9767 would invalidate a diagonal count.

Regards,
Ahmed Farghaly

Wednesday, April 11, 2012

USDJPY elliott wave counts

As illustrated above, It seems evident that the correction/initial leg of the correction is complete as of today's low. We have a complete 5-3-5 zigzag correction lower from the wave 3 extreme labelled on the chart, we happen to channel perfectly and we also have divergence between waves A & C. A break above the wave b(circle) high would invalidate any form of 1-2-i-ii count however a breach of the channel baseline would be an early signal. Notice that we made it right into the extreme end of the 4th wave of lesser degree and right between the 38.2-50% retracement of the third wave rally.

Regards,
Ahmed Farghaly

AUDUSD update


The 'potential' key reversal day pattern has been confirmed as of yesterday's close, We had an outside candle and the candle closed less than 40% of its range measured from the low, as discussed yesterday this has very bearish implications, Another thing I'd like to note is the reverse 1-2-3 candle pattern visible on the chart above (a reverse 1-2-3 is when the range of the 4th candle (setup candle) engulfs the previous 3 candles.) a trade should be triggered at a close bellow the high/low of the setup candle, personally I would pass on the trade if it signals a long due to the elliott wave count, accelerating momentum and the bearish key reversal day witnessed yesterday.

Regards,
Ahmed Farghaly

Tuesday, April 10, 2012

USDJPY final thrust lower

The USDJPY is in the wave 5 of 5 of C (preferred) a breach of the wave 4 triangle's orthodox end would be the first signal of a trend change, further confirmation shall occur as prices breach the 81.87 high.

Regards,
Ahmed Farghaly

AUDUSD count update

As visible above prices did indeed reverse and it looks like we are heading lower, there are a few things to note about the chart above. One is that if this is going to be a third wave down it needs to adhere to the personality one would expect of a third wave, which simply means that prices need to decline very soon in a steep manner, If they don't then that would question the validity of such a count and would make me search for alternatives. I dont think however that this labelling will need to be changed substantially. Another point to note is the MACD hook signal that might be occuring (MACD hook is when the signal line briefly penetrates/attempts to penetrate the MACD line(red) and is followed by a quick reversal. An illustration of this signal is present above which occured very close to the 2012 peak. Another point to note is the high formed on Apr 3rd would most likely hold due to the tendecy of the market to remember its firsts as explained on one of the previous posts on the GBP/USD currency pair. Alot of evidence complements this wave count.

Notice above that we are potentially forming one of the most common bar/candle patterns traders look for, which is a "Key reversal day" pattern. A breaish key reversal day is when the current candle makes a new high relative to the previous candle yet manages to close bellow the previous candle's close. This pattern has even more bearish implications if it turns into an outside candle (higher high than previous candle and lower lowe than previous candle) and also if it manages to close less than 40% of the candle's range measured from the low of the day.

Regards,
Ahmed Farghaly

USDJPY count update


As mentioned on the earliar post on this currency pair, I had a target of 81 the figure for this down move, We have made it quite close to this target as of today's lows, I am anticipating a turn to the upside for a wave 5 (preffered) or wave iii of 3. Enter long at a break of 81.87 with a target above the 84 handle for now, as price structure unfolds we'll get an idea of where to expect the upcoming bounce to terminate.

Regards,
Ahmed Farghaly

Saturday, April 7, 2012

Momentum analysis on AUD/USD


Bear in mind the alternate posted on this previous post
http://competent-trades.blogspot.com/2012/04/point-to-note-on-gold-and-audusd.html

Regards,
Ahmed Farghaly

S&P 500 counts


The above chart clearly explains why the 2000 high is certainly not the supercycle peak. It also highlights the perfect alternation between waves 2 & 4 in time, construction and intricacy(subdivisions).
Due to the extremely low volume(which is typical near or at the end of second waves) the wave patterns since the end of the wave (B) triangle seems difficult to read we are currently at the 50% expansion target of wave A, Here are my two counts. The dashed range shows the price zone of the (2)nd wave of the 07-09 decline which is where you'd look for a second wave of larger degree to terminate (after breaching the 4th wave zone).

This market has been able to remain resilient, to an extent, to the declines in the european bourses which suggests that the above count could prove to be the right count, However I would rather jump out my window off of the 14th floor than buy, even if the second count (the one right above) proves to be correct. This is going to fall and its going to be bad. Look at the longer term Dow analysis posted soon after this blog was brought back to life. Every great story has an ending. The rally from 2009 was indeed a great story, infact it saw the s&p more than double in price, the economy improved and unemployment dropped. I see the euphoria surrounding this rally every day on CNBC... I certainly hope they enjoy it now because as stocks plummit in the near future so will thier viewers due to widely shared feeling of disgust that will arise towards stocks. Most of the people celebrating on TV will have to be laid off due to sharp declines in thier advertising revenues. Thats if they dont shut shop competely.

Another point to note is the sudden rise in speculative targets for Apple(1000+ & 2000+), which is nothing more than a guarentee of an approuching reversal.

Regards,
Ahmed Farghaly

Egyption Stock Market. BUY, BUY, BUY!!!


Here is a look at the EGYPT CMA General market index the pattern is exceptional to say the least.

 Bellow is a more detailed looks on the technicals of the EGYPT CMA General Index a turn took place and this Index exploded higher. The Blue chip index EGX30 is analyzed bellow, we had divergence between the two since the 09 lows, typical Dow theory non confirmation of the revolution lows.

I dont remember which Rothchild said, "Buy when there is blood on the streets" What occured in Egypt in 2011 is certainly a trough in social mood as illustrated in the pictures above. If not one that would last decades (Preferred count) then certainly for many years to come.

On a shorter scale I'm counting the 2012 advance into march as wave 1 on the CMA and EGX currently in wave 2, the upcoming advance in arabian equities in general should be a broad third wave. So as the title of this post suggests... BUY, BUY, BUY!!!
Regards,
Ahmed Farghaly

Friday, April 6, 2012

AUD/USD count update


Keep in mind the alternate count of a diagonal triangle in formation or this bounce could prove to be wave 1 of (5) very unlikely. The invalidation of the diagonal pattern as stated earliar is 0.9767

Regards,
Ahmed Farghaly

Wednesday, April 4, 2012

Point to note on GOLD and the AUD/USD an elliott wave prespective.

Today was the 8th biggest dollar decline in gold in history, due to the few emails I've gotten about this event, I have decided to write this in depth analytical report. First let us look at the current supercycle in GOLD

It seems evident that the downside risk is huge in terms of this chart alone, let us look at Long term chart of the AUD/USD to make us worry even more ;-)

The high present on the chart above coincided with that high of the primary third wave of cycle wave III of supercycle wave (III), hence it seems logical to speculate, considering the high correlation between this currency pair and the gold market, that the 1974 high on the AUD/USD is the all time high achieved despite the unavailability of data prior to that date. as pointed out on the chart the primary wave 2(circle) rally diverged with the cycle degree peak in gold in 1980, and gold made a higher low in 2001 as this market decline into its final push which signaled a rally to come on the AUD/USD. What we can conclude about these two occurrences is that this currency pair lags the gold market, and significant divergence between both usually indicated a change in trend. Now looking at the current position of the market, Gold broke out above the cycle degree peak of 1980 while the ozzy is still substantially bellow its 1974 peak taking the wave counts into prespective the implications of such a divergence could be fairly catastrophic for both of these markets. Considering the several alternate counts present on the gold market (one which supports the idea that the advance in 2012 was a failure fifth [most likely] or wave 5 still in process), let us take a look at a shorter term ozzy chart to narrow the possibilities.

This happens to be my preferred count supporting the idea of a failure (5)th wave of intermediate degree which terminated the cycle degree correction. On a shorter term basis we either are in the process of an extended 3rd wave of minor degree as visible above or we are forming some sort of expanded flat correction to the upside for our wave 2 of minor degree. Here is my alternate scenerio.

 This picture was taken some time ago proposing this count as an alternate, the proposed wave 4 in this alternate has declined further but this alternate count has not been invalidated yet, However improbable this count may seem, it still remains valid until this pair trades bellow 0.9767 which would make wave 4 larger than wave 2 and would break the rules of a contracting diagonal triangle. Looking at this pairs sister, the kiwi my counts are as follows.

The wave (1) decline from the May 2011 high was a 3-3-3-3-3 expanding diagonal. A point to note however wave 5 of that pattern was shorter than wave 3 which is not typical of expanding diagonals however looking at all the other rules and guidelines it seems like the highest probability count. of course an alternate for the 2011 decline would be wave (a) instead of wave (1) however odds greatly favor the labeling visible on the chart above.

Regards,
Ahmed Farghaly