The market till date tells us a very exciting story. First let us start with an update of the NZD/USD. (This is an update of the chart posted here
http://competent-trades.blogspot.com/2012/04/point-to-note-on-gold-and-audusd.html)
As evident on this long term chart the year 2000 low was the end of an impulsive pattern to the downside that started in the 70's and it seems likely that that the corrective rally seen since then is complete as of the 2011 high.
Posted above is a smaller time frame chart, there seems to be enough evidence (highlighted above) that a turn is indeed upon us. There seems to be symmetry in the head and shoulders top highlighted above, usually a parallel line to the neckline of the head and shoulders pattern reflected off the left shoulder gives and estimation of where the right shoulder will end. If you examine the above chart carefully you will notice that the right shoulder ended exactly at a touch of the the parallel line. Minimum objective for this trade is 0.6580 which is where the diagonal triangle began. When the head and shoulders proves complete we'll also have another measuring tool to further narrow down our targets. The 1.618x wave (1) target lies close to 0.6100

Another point to note on the NZD/USD currency pair is the moving average compression (13,21,34,55 SMA) that occured on a daily chart of this currency pair. First lets explain what a moving average compression is, a moving average compression is when various moving average coil together like christmas lights. Moving average compression occurs when there is little price movement i.e the market is a contraction phase. We all know that market contraction (corrective waves) is unsustainable and eventually leads to market expansions(impulse waves) which has started as of last weeks break out. Another technical point to note about this currency pair is the Average directional index (ADX 14 period) indicator, The down trend started to gain strength as the ADX popped above 20 (current reading on daily chart 28.57) notice that the reading on the daily still doesn't suggest that the trend is at an extreme which would be a reading above 40 which simply states that this down trend still has room to strengthen even more.

Above is my alternate count. This count suggests that the cycle wave decline from the 70's that bottomed in late 2000 was a wave C and we are seeing a serious of 1st and 2nd wave as illustrated above on this chart. In either case our minimum objective is where the diagonal wave 5 of C has started and that takes us towards the 0.6580 area again.
Now lets take a quick look on the AUD/USD which tell us a very similar story.
Above is my preffered count on the AUD/USD similar to the kiwi I see a completion of a corrective pull back from the 2000's low ( wave c(circle) relationships 3 = a little more than 4.236x1 wave 5 = wave 1). Notice the divergence on the RSI between the wave A (circle) and wave C (circle). The technical conditions are very similar to the NZD/USD with similar alternates as well.
ALT on the AUD/USD similar to that on the kiwi with a series of 1st and seconds from the 2000's low.
This count seems to be in contradiction with those on other commodity currencies however still seems possible from a structural perspective which is why it is being discussed and presented on this post.
Above is a shorter time frame chart focusing in on the wave (5) and the subsequent price action, if you recall I have mentioned earlier on this blog the idea that financial markets remember their firsts, now what does that mean on a monthly basis, it means that the high for the month is usually seen within the first few days of the month, and the range of such a candle (Apr 3rd in this case) acts as resistance/support (resistance in this case) Prices made it back into the range and failed to close above the Apr 3rd peak which proved to be a fantastic selling opportunity.
Above is one of the two counts I have on gold. I would like to state that I have no preffered count on this market. In this count however the wave (3) of 5(circle) is the shortest wave in the wave 5(circle) sequence on logarathmic scale but not on arithmatic scale and due to that I hold the alternate count presented bellow.
This count supports the idea of a more complex 4th (circle) wave, it calls for another push higher upon completion of the wave (4) of 5 (circle). Some people would argue that such a count would mean that a commodity currency such as the AUD/USD would pop higher before selling off as I am anticipating. That argument makes sense at first, but if you study the charts posted on the link presented earliar you will notice that the AUD/USD market is the weaker of the two, lags on the upside and leads on the downside.
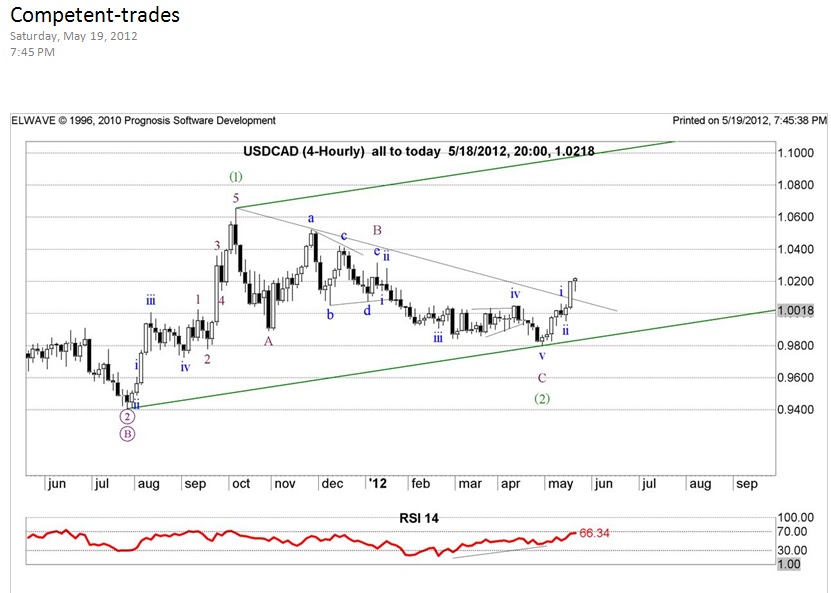
It seems like a highly probable low has formed, and this currency pair should pop in a (3)rd wave higher. ALT count on weekly chart would be that we are currently in wave XX of wave 2/b(circle). View
http://competent-trades.blogspot.com/2012/04/usdcad-update.html for an in depth look at this currency pair
A flat pattern since Oct. 2011 seems complete as of the late march low on this currency pair. The stage seems set for a third wave rally. (View
http://competent-trades.blogspot.com/2012/05/usdrub-and-what-it-means-for-eurusd.html &
http://competent-trades.blogspot.com/2012/04/collapse-of-russia.html )
Now that we've looked into commodity currencies, which point towards US dollar strength with significant clarity, It is time to look at the GBP/USD & EUR/USD.
Unfortunately the European currencies don't show as much clarity in terms of wave structure as most commodity currencies. The count above is my preferred on the GBP/USD it seems possible that the turn is upon us but there exists alternates that support perhaps one more push higher, hence I wouldn't start aggressively shorting this pair unless the 0-b trendline above is broken to the downside. Now remember every chart has a wave count but not every wave count is a trade which is why I'm more cautious with this than I am with the commodity currencies (CAD,NZD,AUD,RUB).
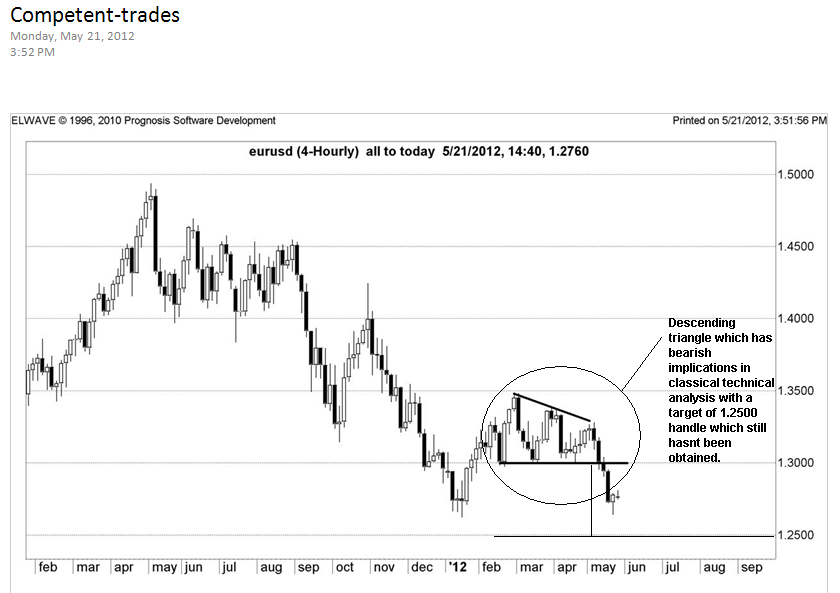
Posted above is my count on the EUR/USD this count suggests a continuation of the declines (ALT still in wave (2)) (view
http://competent-trades.blogspot.com/2012/04/eurusd-elliott-wave-counts.html for more details)
Now lets take a look at the CHF pairs
I have to admit, I wouldn't normally labell the wave (2) low (ALT still in wave (2)) so prematurely in terms of price and time however we need to realize that the price floor set by the SNB on the EUR/CHF stopped the CHF from rallying significantly against the USD and its European peers which is why I'm willing to accept a wave (2) low in place ( another factor is the outlook on commodity currencies which support a dollar bull which most likely wont be an isolated move on them alone) perhaps I'm rationalizing which is why I would rather wait for more confirmation on this currency pair, unless I plan on taking a position set up and place a stop bellow the all time low. (view
http://competent-trades.blogspot.com/2012/04/usdchf.html )
Above are my counts on the GBPCHF I believe that the lows seen in augest last year terminated an ABC decline since the early 70's. The wave (2) decline could be done if so prices need to gain momentum very soon.
Posted above is the EGYPT CMA general index, a supercycle low could have been placed as of the dec 2011 lows, be on the look out for a third wave rally to kick off this year. (View
http://competent-trades.blogspot.com/2012/04/egyption-stock-market-buy-buy-buy.html)
I haven't changed my counts on the S&P (European Indices are in a third wave down of intermediate degree as highlighted on the 'Collapse Of Russia' post) Please view the following for S & P counts
http://competent-trades.blogspot.com/2012/04/s-500-counts.html
http://competent-trades.blogspot.com/2012/04/s-fibonacci-time-analysis.html
From an analytical prespective, it seems evident that the clearest charts of all discussed above are the commodity currencies, I would go short the CAD, NZD, AUD & RUB against the USD. I am also intersted in playing the USD/CHF (Thankfully I'm already long this pair from last year) since it looks like the CHF will underperform relative to the EUR & GBP (judging from the counts on the EUR/CHF & GBP/CHF respectively). Wait for confirmation on the USD/CHF though.
Regards,
Ahmed Farghaly
 NZDUSD: It seems evident that we are in wave 4 higher at this point, similar to the counts we have on the USDCAD, EURUSD & USDCHF.
 This is the USDCHF posted above.
 EURUSD: Wave 4 limit: 1.2800
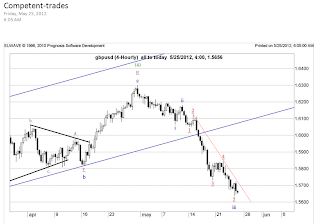 GBPUSD