Wednesday, November 7, 2012

GBPNZD The end of a 12 year impulse


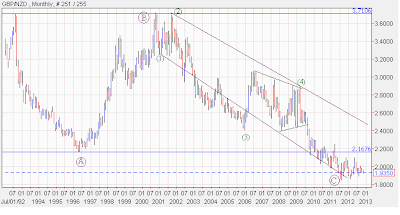
Looking at this chart that dates back to the early 90's it seems evident that this currency pair experienced a flat correction to the downside. Unfortunately I dont have the data going back further which means the begining of the wave A(circle) to the downside can be something else. What we are certain of however is that the move that kicked off in the year 2000 has clearly unfolded into 5 waves down off the high wave 3 being 2.618 of wave 1 and wave 5 ending slightly bellow the thrust measurment  . The picture bellow shows a more detailed look at the 5 wave decline off the 2000.


The decline was a textbook impulse wave to the downside, the 4th wave unfolded into a running contracting triangle which signals to us that the following move to the downside is the last wave of the sequence and the move to follow would typically make it back to its terminus considering the guideline that states corrections usually end by the terminus of the previous fourth. Thats ofcourse IF the upcoming move is a correction. Also notice the divergence seen on the RSI 14 indicator. also notice the unfolding head and shoulders pattern as visible on the chart. Another point to note is the double bottom that formed on this chart as well. As of now this idea remains a possibility however it would become more probable if the standard chart patterns talked about above give way.

Regards,
Ahmed Farghaly
Monday, November 5, 2012

EURAUD a clear wave pattern


Posted above is a long term chart of the EUR/AUD the pattern that took place since 1999 is that of an expanded flat correction correcting a move dating back to the 70's. Points to note is that the pattern roughly ended and the 1.618x wave A (circle) which is a typical target for wave C of an expanded flat. Also notice that the move lasted 13 years which is a fibonacci number. Looking at the C wave in greater detail we can see that the the 5th intermediate wave was 0.382x the distance traveled from wave (1) through (3). Supposing that this pattern was not an expanded flat we can still expect a significant correction from the move that started in 2009 which lasted 3 fibonacci years. This chart is full of fibonacci time clusters which leads me to believe that the low seen this year is indeed a low of cycle degree and a significant move to the upside can be expected. Another point to notice is the strong divergence between wave (3) and (5) as highlighted on the chart above. also if you look closely into the chart you will notice that rallies of significance in this chart was accompanied by declines in risk sentiment. This currency pair rallied in 2000 as the nasdaq crashed, and rallied as well during the financial crises. All this evidence suggests that we are entering a long waited for risk off mode. Another technical aspect to notice is the potential inverse head and shoulders that is forming as we speak.


 looking at the 2012 rally it very much seems impulsive followed by a text book 5-3-5 zigzag which took us into the 38.2% retracement of the 2012 rally, we also made it back into the wave 4 vicinity of one lesser degree all of which suggest that a continuation of the uptrend shall occur from current levels the alternate count is that the decline is only wave A/W of a more complex correction however R.N. Elliott says that the simplest pattern is typically the right interpretation. A breach of the corrective price channel ( which contained the entire move typical of corrective patterns) on the upside would be the first confirmation of a move to the upside. This currency pair seems the clearest out of all, looking at my analysis on the EUR/USD the eur is expected to decline against the USD which suggests that the AUD/USD (which is not clear from a wave perspective) Shall fall harder and be of the biggest losers typical of a risk off enviroment. However I dont like to trade currencies in which I dont see patterns I recognize hence I would much rather look for clues on this pair for a move to the upside.

Regards,
Ahmed Farghaly

Also view: http://competent-trades.blogspot.com/2012/04/point-to-note-on-gold-and-audusd.html

Saturday, November 3, 2012

EUR/USD a running flat?


Our count of a fourth wave triangle got invalidated at a breach of the 1.2880 mark. I am counting this wave C complete as of the OCT 17th high (5th wave of C was a failure). The pattern that the purple wave 2 unfolded as was a running flat, since the wave C failed to breach the end of wave A. Another point worth noting is that markets tend to put in thier high/low of the month in the first few days of that month. we have a significant high on the NOV 1st. the wave count plus other technical studies suggest that this is going to be the high of the month. Purple wave 3 is currently under way and shall take the EUR down to new lows for the year.


Regards,
Ahmed Farghaly

Thursday, November 1, 2012

EUR/USD update


Following the EUR/USD count, It seems evident that the triangle is complete (critical support 1.2880). Our alternate count suggests that we are still in a wave d to the upside. One rule of a triangle formation is that only one of the legs are complex and the rest are simple zigzags, in this particular case the wave B was a complex double zigzag which means that the rest of the waves should be simple which is why I'm calling this triangle complete despite wave d and e's small size relative to the rest of the triangle waves. Any how this count forcasts a move towards the 1.3400-3500 range before we can look for a turn in favor of the US dollar.

we also have a bullish slingshot on the MACD which is reverse divergence, a lower low on the MACD vs. a higher low on the price chart, this is usually a signal for a turn to the upside.

Regards,
Ahmed Farghaly