Monday, December 10, 2012

Is the US bear market back into play?


The DJIA seems clear from a wave perspective, It seems probable that the move the kicked off in March 2009 has completed and the move to the downside has started. Wave (A) of this correction has unfolded into an impulse while wave (C) has unfolded into an ending diagonal. Let us keep in mind that if the ending diagonal count is accurate a swift sharp move is expected to unfold to the downside which shall fully retrace the diagonal in less time than it took to form. The beginning of the diagonal was at 9664 (minimum target). Another point to note is the double divergence/ triangle that formed on the MACD which is typical of an ending diagonal. If indeed the 2nd wave (march 2009 - October 2012) has completed we can expect the decline to take us bellow the march 2009 lows as wave 3 unfolds.

Regards,
Ahmed Farghaly

Wednesday, November 7, 2012

GBPNZD The end of a 12 year impulse


Looking at this chart that dates back to the early 90's it seems evident that this currency pair experienced a flat correction to the downside. Unfortunately I dont have the data going back further which means the begining of the wave A(circle) to the downside can be something else. What we are certain of however is that the move that kicked off in the year 2000 has clearly unfolded into 5 waves down off the high wave 3 being 2.618 of wave 1 and wave 5 ending slightly bellow the thrust measurment  . The picture bellow shows a more detailed look at the 5 wave decline off the 2000.


The decline was a textbook impulse wave to the downside, the 4th wave unfolded into a running contracting triangle which signals to us that the following move to the downside is the last wave of the sequence and the move to follow would typically make it back to its terminus considering the guideline that states corrections usually end by the terminus of the previous fourth. Thats ofcourse IF the upcoming move is a correction. Also notice the divergence seen on the RSI 14 indicator. also notice the unfolding head and shoulders pattern as visible on the chart. Another point to note is the double bottom that formed on this chart as well. As of now this idea remains a possibility however it would become more probable if the standard chart patterns talked about above give way.

Regards,
Ahmed Farghaly

Monday, November 5, 2012

EURAUD a clear wave pattern


Posted above is a long term chart of the EUR/AUD the pattern that took place since 1999 is that of an expanded flat correction correcting a move dating back to the 70's. Points to note is that the pattern roughly ended and the 1.618x wave A (circle) which is a typical target for wave C of an expanded flat. Also notice that the move lasted 13 years which is a fibonacci number. Looking at the C wave in greater detail we can see that the the 5th intermediate wave was 0.382x the distance traveled from wave (1) through (3). Supposing that this pattern was not an expanded flat we can still expect a significant correction from the move that started in 2009 which lasted 3 fibonacci years. This chart is full of fibonacci time clusters which leads me to believe that the low seen this year is indeed a low of cycle degree and a significant move to the upside can be expected. Another point to notice is the strong divergence between wave (3) and (5) as highlighted on the chart above. also if you look closely into the chart you will notice that rallies of significance in this chart was accompanied by declines in risk sentiment. This currency pair rallied in 2000 as the nasdaq crashed, and rallied as well during the financial crises. All this evidence suggests that we are entering a long waited for risk off mode. Another technical aspect to notice is the potential inverse head and shoulders that is forming as we speak.


 looking at the 2012 rally it very much seems impulsive followed by a text book 5-3-5 zigzag which took us into the 38.2% retracement of the 2012 rally, we also made it back into the wave 4 vicinity of one lesser degree all of which suggest that a continuation of the uptrend shall occur from current levels the alternate count is that the decline is only wave A/W of a more complex correction however R.N. Elliott says that the simplest pattern is typically the right interpretation. A breach of the corrective price channel ( which contained the entire move typical of corrective patterns) on the upside would be the first confirmation of a move to the upside. This currency pair seems the clearest out of all, looking at my analysis on the EUR/USD the eur is expected to decline against the USD which suggests that the AUD/USD (which is not clear from a wave perspective) Shall fall harder and be of the biggest losers typical of a risk off enviroment. However I dont like to trade currencies in which I dont see patterns I recognize hence I would much rather look for clues on this pair for a move to the upside.

Regards,
Ahmed Farghaly

Also view: http://competent-trades.blogspot.com/2012/04/point-to-note-on-gold-and-audusd.html

Saturday, November 3, 2012

EUR/USD a running flat?


Our count of a fourth wave triangle got invalidated at a breach of the 1.2880 mark. I am counting this wave C complete as of the OCT 17th high (5th wave of C was a failure). The pattern that the purple wave 2 unfolded as was a running flat, since the wave C failed to breach the end of wave A. Another point worth noting is that markets tend to put in thier high/low of the month in the first few days of that month. we have a significant high on the NOV 1st. the wave count plus other technical studies suggest that this is going to be the high of the month. Purple wave 3 is currently under way and shall take the EUR down to new lows for the year.


Regards,
Ahmed Farghaly

Thursday, November 1, 2012

EUR/USD update


Following the EUR/USD count, It seems evident that the triangle is complete (critical support 1.2880). Our alternate count suggests that we are still in a wave d to the upside. One rule of a triangle formation is that only one of the legs are complex and the rest are simple zigzags, in this particular case the wave B was a complex double zigzag which means that the rest of the waves should be simple which is why I'm calling this triangle complete despite wave d and e's small size relative to the rest of the triangle waves. Any how this count forcasts a move towards the 1.3400-3500 range before we can look for a turn in favor of the US dollar.

we also have a bullish slingshot on the MACD which is reverse divergence, a lower low on the MACD vs. a higher low on the price chart, this is usually a signal for a turn to the upside.

Regards,
Ahmed Farghaly

Wednesday, October 31, 2012

EUR/USD Elliott wave perspective


Its seems evident that the EUR/USD is in a contracting triangle wave iv down as of the daily chart posted above. All of which are part of a wave C of an expanded flat correction higher as seems evident on the chart above. the iiird wave travelled 2.618x of wave 1 hence was the extended wave which means we can expect the fifth wave to resemble wave i which means it most likely will be a swift short thrust out of this triangle wave iv after completion (currenctly in wave d of the wave iv triangle)

Looking at the triangle in greater detail it seems evident that wave B was the complex leg (Double zigzag)of the triangle which signals that the ONE complex leg to be expected in the triangle is complete and the rest of its legs will most likely be single and simple zigzags.


looking at wave d of the triangle is greater detail my preferred count is the i-ii-iii count rather than calling wave d complete. I hold this preffered count for several reasons.
1) The move is not contained between 2 parallel lines which is typical of a i-ii-iii count
2) The wave iii travelled 1.618x wave i which is a typical target for wave iii
3) The wave ii retraced almost all of wave i which is not typical of a wave b which mostly is limited to 79% of wave a

Regards,
Ahmed Farghaly

Thursday, October 25, 2012

USD/CAD analysis

 From an Elliott wave perspective it seems like we a tracing out a flat correction from the 2011 highs. The key pattern that screams out "correction" is the wave B triangle that occurred in the wave (A) down of this flat. My alternate count is that we traced out a double zigzag correction which would mean that the correction is complete. What I don't like about that count is that the wave C of the second zigzag down is quite large relative to the A wave. The count presented above is the one that satisfies the rules and guidelines of the wave principle. The leading diagonal wave 1 signaled an extended 3rd wave to come in wave C which is what occurred (wave 3 being almost 2.618 of wave 1). Ideally this is where one would expect that wave 4 bounce to stop since we are in the area of the previous 4th wave, we are also at the upper boundry line of the corrective price channel, we are also at the 38.2% retracement of the wave 3 decline and the AO indicator made it above the zero line which one would expect in a 4th wave bounce. I wouldn't suggest shorting this currency pair since the 5th wave I'm expecting is likely to be a small decline considering the extended 3rd wave. Now lets add in some standard technical analysis
Looking at this weekly chart it seems evident that there very well might be an inverse head and shoulders pattern in this currency pair. If you look closely you'll notice that it formed 2 heads making it of the complex type. If you are a conservative long term trader you can wait for a breach of the neckline of this pattern before going long for a sizable move to the upside. It could take months to get there but it increases the probability of a successful trade.

Regards,
Ahmed Farghaly

Tuesday, July 10, 2012

EURGBP: A change in outlook

The EURGBP is in primary wave 3 down of Cycle wave 1/A. It seems evident from the running flat correction  (that ended in a contracting ending diagonal wave C for primary wave 2) that the upcoming decline would most likely be the extended wave. Hence, If I were only trading currencies. This is what my trades would look like based on broad based analysis for the rest of the year.

Alternate count cycle wave V(red) is not complete and we are currently in a multiple zigzag wave 4 (Circle), hence we will avoid shorting the EURGBP directly, instead we will position ourselves in trades that are likely to work out regardless what occurs in the EURGBP but will profit handsomely if our preferred count works out


Short EUR/USD
Short NZD/USD
Short CAD/JPY
Short AUD/JPY
Short NZD/JPY
Long USD/CAD
Long USD/CHF
Long USD/NOK
Long GBP/AUD
Long GBP/CAD
Long GBP/NZD
Long Gold/CAD


Regards,
Ahmed Farghaly

Monday, July 9, 2012

EURUSD: A supercycle perspective


The EURUSD looks like a mirror image of the USD/NOK if you look back into the early 70's. It seems evident that in 2008 this market put in its Cycle Wave C high which lasted aprox 8 years, Not only is that a fibonacci number it also is equal to the time of the initial advance into the early 90's (Cycle wave A). Notice that we made it right towards the wave IV of smaller degree which put in its high in the early 70's. The outlook is terribly bearish for this pair. If you have been resisting shorting due to what some would argue to be a bearish extreme in sentiment, perhaps you should reconsider at the breach of the neckline of the complex head and shoulders pattern that would end about 7 years of basically sideways movement!

Regards,
Ahmed Farghaly

USDNOK Elliott wave

Another currency pair suggesting a strong US dollar in the upcoming years is the USDNOK notice the textbook 5-3-5 zigzag decline from the 1985 peak in the US dollar, Another point worth noting is that the annual rate of change indicator made an all time high in 2008. This condition is called a Megaoverbought reading which is typically the kick off of a young and vibrant bull market. This market adds to the evidence for the US dollar bull presented since second quarter 2011.

Regards,
Ahmed Farghaly

3rd quarter 2012 portfolio final

T-bills = 33%

Currencies, commodities & stock futures:
Long USDCAD, long Gold/EUR & long Eur/CAD net position = long Gold/CAD,, short S&P & Nasdaq futures

Equities:
Egyptian equities.
Issues based on valuation:
ETEL: Telecom Egypt
POUL: Cairo poultry
EGTS: Egyptian for tourism and resorts.
MIPH: Mina pharm

Regards,
Ahmed Farghaly

Tuesday, July 3, 2012

It's is still early into the bull market despite the 40% rally this year

This is the DJ Egypt titans 20 index this is one of the indexes(the Egx 30 is the other) that ended with what I'm proposing to be a C wave failure which was about 61.8%x wave A. The EGX70, CMA general index & EGX100 made new lows in early 2012 & late 2011 relative to their 09 lows which I'm labeling the end of a super cycle correction. Notice the decline in volume towards the end of the super cycle decline, which is typical of what one would expect at the end of a second wave. Also notice that the volume during this year's bull run exceeded that of the previous bull market going into the peak in 2008. Another point to note is the potential inverse head and shoulders pattern that has been forming going into 2012,with a target above the 2010 high if the neckline is to be breached. If this target is obtained that would complete an even larger double bottom pattern ( 2009 low & 2011 low) which would project a target on logarithmic scale above the 2008 peak on this index, of course if this proves to be a super cycle degree low (which would be confirmed by an ROC 12 month period reading of above 100% or 1.0 depending on how your platform indicator) this bull market would exceed every bodies expectations. Another point to note is that intermediate wave two's extreme of social mode was evident by the cases of kills apparently by 'extremists' of 3 people for being liberal and enjoying their rights, is this highlighting an intermediate degree wave (2) correction extreme?

Regards
Ahmed Farghaly

PS a breach of the June 2012 lows would invalidate a wave (2) low. A decline bellow the Dec 2011 low would invalidate the wave (1) labeling.

Wednesday, June 27, 2012

AUD/USD: Time to short risk into next week?


From an Elliott wave perspective it seems evident that the AUDUSD is in the terminal stages of a correction to the upside that started 3 days ago. Confirmation of completion would be a breach of the trendline visible on the chart. Whats even more exciting is how lined up this is with a chart of the S&P Futures chart as visible bellow.


Strong resistance lays at 1330 basis the September contract.

Regards,
Ahmed Farghaly

Monday, June 25, 2012

Egyptian stock market fun (ESMF)


Bellow is a more detailed look at the supercycle correction (basis the EGX70) that started in 2008. Please view the other post labelled "Egyptian stock market BUY BUY BUY!!!" Which looks at other Egyptian indexes from a wave perspective as well.


The absolute beauty of the wave principle.

This is what I posted to a few fellow traders and friends and hour before the open.

"This is the less widely followed EGX70, The EGX30 has bottomed in december 2011 and has not confirmed the new lows made this year by the EGX70 as expected. The Egyptian market gentlemen is setting stage for a strong rally despite the global risk off mode. The Egyptian economy is going to experience 'catch up' growth as did many of the economies in the emerging markets.


Regards,
Ahmed Farghaly


P.S. Confirmation would be a close above 440 (aggressive) A close above 530 ( conservative) on this index. Stop Bellow the low that is forming/has formed."

This index is up over 6% today, and this is a broad index, comprised of 70 stocks (rather than the EGX 30 [Main egypt index] which is comprised of only 30 stocks [which didn't confirm the 2012 lows to all the dow theorists our there [Dow theory signal buy signal would be established by a break of the 2012 highs on both the indexes stated above]). Other Egyptian indexes are up 8 and 7 %.

Now socionomically speaking we know that wars/ civil wars (or revolutions) occur towards the end of bear markets of primary degree or larger. Infact according to the teachings of Robert Prechter. the 12 month (annual) ROC on various indexes reached extreme negative values. In fact on the CMA general index it reached -81% in Dec 2011 which was even a greater extreme than the readings seen in 1932 in supercycle wave (IV) on the Dow Jones Industrials, this analagy suggests that the lows formed/forming are atleast of supercycle degree.


Only the wave principle can make you look at the markets in this way and in that great a detail.

Regards,
Ahmed Farghaly

Thursday, May 24, 2012

Time to take some profits?

Posted bellow are a quick view of my counts, the evidence supports a weaker dollar in the short term, but soon we'll resume the risk off trend all over a gain. Take a look.

NZDUSD: It seems evident that we are in wave 4 higher at this point, similar to the counts we have on the USDCAD, EURUSD & USDCHF.

USDCAD:Based on alternation the wave iv that is yet to unfold could be a flat/a triangle, in either case I'd expect at least a 23.6-38.2% retracement of wave 3. 
 This is the USDCHF posted above.
EURUSD: Wave 4 limit: 1.2800
GBPUSD

I will proceed by scaling out some profits from the USD longs in anticipation of a wave iv & 4 which would reflect short-term USD weakness.

Regards,
Ahmed Farghaly

Tuesday, May 22, 2012

GBPUSD & USDCAD update


It seems interesting that these two pairs share the same sequence of waves, we are currently set to fall on the GBPUSD to 1.5570 and rally on the USDCAD to 1.0350.

Regards,
Ahmed Farghaly

Monday, May 21, 2012

NASDAQ 100 update


It seems evident that the third wave lower from the top is complete, achieving the 1.618x target of wave 1 and we are currently rallying in a wave iv higher towards the 2574-2610 I wouldn't put too much wieght on this rally guys.

Regards,
Ahmed Farghaly

GBPUSD count

The Sterling is setting stage for a move towards the 1.5880-5900 in its wave iv higher. We'll read into the structure once we get there.
The ALT count is : still in wave b down.

Regards,
Ahmed Farghaly

EURUSD potential wave counts

If my outlook on the the GBPUSD USDCAD & NZDUSD shall prove accurate then this is most likely the count on the EUR. From an elliott wave perspective, considering that the wave ii(blue retraced) more than 61.8% of wave i (blue) we can expect wave 4 to retrace 38.2% or less of wave iii which gives us a ceiling of 1.2890. Prices then should decline towards or bellow the 1.25 handle.

As defined by Edwards & Magee a descending triangle has bearish implications from a classical technical analysis point of view, this pattern's measurment implications suggest a move towards the 1.2500 mark which hasent been met as of yet.

Notice the moving average compression that suggested that the market has been in a contraction phase for sometime and is bound for an expansion. Also notice that we are bouncing off the lower end of the bollinger band which suggests an extreme hence the assumption that wave iv(blue) higher is under way.

Above is a valid alternate count.

Regards,
Ahmed Farghaly

GBP/USD 2 hr chart


It seems to be presenting a good short opportunity soon, watch for the 1.5900 handle it looks like prices would struggle at that area and decline for a fifth wave lower.

Another point to add is that the thrust measurement of the ascending triangle & the 0.618x the inverse head and shoulders measurment is at 1.5900

This is another potential count that suggests that the wave iv is over, but ofcourse it is well bellow the previous fourth wave of lesser degree which is where you'd expect this wave iv correction to terminate take a look.


Regards,
Ahmed Farghaly

Sunday, May 20, 2012

NASDAQ 100

This could be the last rally of intermediate degree seen for at least 2 years.I'll let you guess what such a count means for the Apples and the Facebooks.

Regards,
Ahmed Farghaly

R.N. Elliott, Make it or break it?


Ralph Nelson Elliott (28 July 1871–15 January 1948)

Regards,
Ahmed Farghaly

Elliott wave weekend update II

The chart above is of CRUDE OIL futures, it seems evident that we are back in a bearish impulse since the 2011 high as with many commodities, notice the divergence on the RSI as prices where rallying into the 2011 high, we have tested the 0-B trendline and currently are coming off of it, ig you look closely you'll also notice that we have a potential head and shoulders top analgous to the one on the USD/CAD in early May,
The head and shoulders chart is reposted here again in order to illustrate the resemblence.

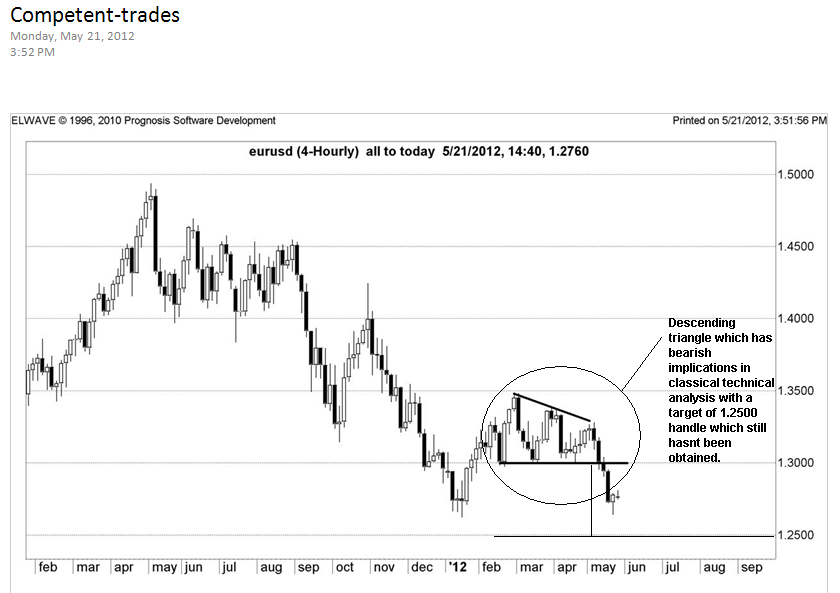
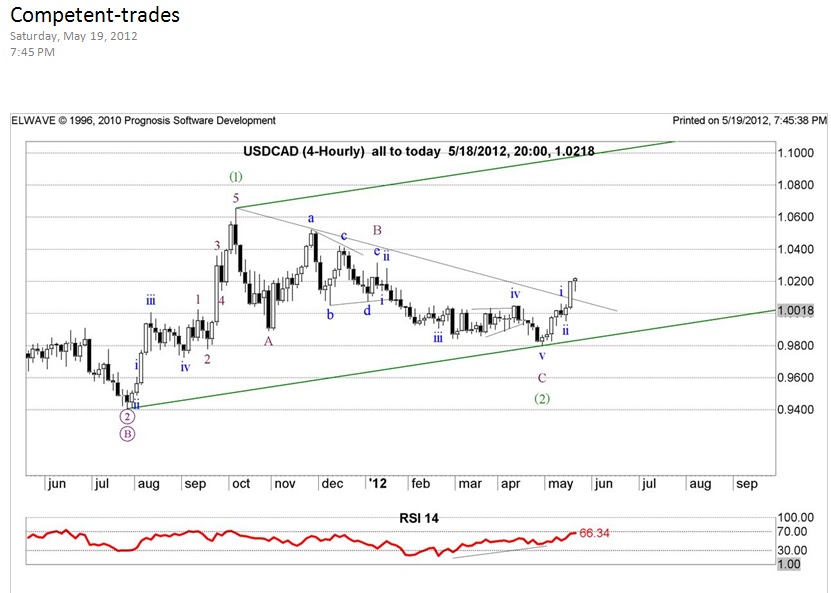
Above is an updated chart of the USD/CAD the latest bounce broke through the most conservative trendline drawn on this chart whcih supports the idea of an intermediate wave (2) bottom in place, targets are well above the 2011 high, as the wave structure unfolds and perhaps breaks the neckline on the head and shoulders pattern posted above we'll obtain more accurate targets.

Posted above is the CAD futures COT data, during early May sentiment reached an extreme with CAD bulls exceeding the 80% mark as highlighted above and the commercials reached a bearish extreme as highlighted above. I would also like to point out that sentiment reached an even greater extreme at the 2011 low on the USD/CAD the greatest in over 10 years which suggests that the 2011 bottom is of great significance.


The USDCAD still has some legs to the upside before completing minor wave 1 which is why I would suggests holding to the longs suggested a day or two from the low on this blog.

The longer term picture on CABLE is quite clear, as illustrated on a previous post on this blog we have a very significant Fibonnaci time cluster at 2012 which suggests that a significant high will occur this year, I believe it has already occured and the wave (4) triangle is complete a thrust to the downside with a target bellow the 1.35 handle is unfolding.

On a shorter time scale, the GBP/USD has completed minute wave iii and shall witness further lows next week, based on alternation the wave ii unfolded into a zigzag hence we should have some sort of sideways price action before falling into a new low for wave v of minute degree all of which will form wave 1 of minor degree.

I have changed my preferred count on the USD/JPY for several reasons, the first one being that in the diagonal count proposed earlier we have no overlap between wave 1 and 4 which contradicts the weakness that the pattern is suppose to reflect, Another reason for the change in outlook is the extreme bullishness of commercials on the JPY as visible on the COT table bellow.

Now lets looks at some commodity currencies,

The NZDUSD continued its decent as anticipated (Early april was the first post building the bearish case). We are now flirting with the neckline of the head and shoulders pattern talked about in the previous weekend update. The wave strucuture still has some legs before putting in a minor low as illustrated on the short term chart bellow.

Notice the oversold figure on the RSI right as we are testing the neckline I have two counts on this shorter term chart my preffered is the one presented above my alternate is that the wave iii(blue) is complete as of last weeks low, in either case a bounce is expected early next week which shall lead into a sell off that would penetrate the neckline of the head and shoulders talked about on May 6th.

One of my most exciting calls this year was the one on the USDRUB. Contrary to what is usually the case this pattern is as clear as the skys of july. Infact the very first post on this blog was about the RUB and the Russian stock market, both of which have proven to be extremely accurate, here are a few pictures and comments from the previous posts on russia.


"As seems evident from the chart posted above, the decline from the wave i(circle) top seems corrective, infact it has broken out of the corrective price channel which signals that the correction is over and the uptrend is back in force. Infact if this count is indeed accurate the upcoming third wave rally shall prove to be a prolonged parabolic explosion. Now what has made me come to such a conclusion? Well several factors.

Factor 1: We had a leading diagonal first wave which signals an extended third wave to come.
Factor 2: Notice how as the wave C of wave ii(circle) made a new low on the price chart it formed what looks similar to a double bottom on the oscillator. Which seems to have been broken to the upside.
Factor 3: An inverse head and shoulders pattern has formed on this 3 hour chart. In an inverse head and shoulders usually the neckline is sloping downwards. However on rare occasion the neckline is sloping upwards, which signal underlying strength in the market. The 'unusual' strength in the market is usually highlighted by a smaller right shoulder relative to the left shoulder which was the case in this particular market.
"

 Above is the the first chart posted on this blog and here is the result.

That is the beauty of R.N. Elliot's discovery gentleman. Speaking of stock indexes lets take a look at the NASDAQ (considering the hype arround the facebook IPO)

As seems evident the bounce from the '02 lows is corrective which channels perfectly as well. Regardless of its structure which is debatable both legs are almost equal in size and we are comming off fibonacci retracement levels on both logarithmic (which is the appropriate scale in this case) and arithmatic scale. I certainly have to take my hat off for the folks in Facebook, not becuase of what they've built which I think will be alot less valuable in the next 2 years, but for the timing of the IPO. They know its a sellers market and they've sold at the right time, Facebook's investers will not share the same smile as that on Mark Zuckerberg's face as he was ringing the opening bell after making over a billion dollars off of the IPO and you can take my word on that.

Posted above is the S&P500 E-mini, it seems evident once again that the top called last april was held and primary wave 3(circle) is upon us. A few points to note is that wave (c) is exactly 0.5 the length of wave A (fibonacci ratio) and the april peak occured arround that 1x  January trading range reflected off of the high of January. At a clusted as such with price hesitating a top can be called which is partly what made me go out on the limb and call for a peak in US equities arround the same time Goldman sachs put out a bullish 'generation' call. As for the early May high/lows, they are likely to hold due to the tendency, emphasized seversal times on this blog, of financial markets to remember thier firsts

Regards,
Ahmed Farghaly

P.S. Please view previous weekend update for preffered and alternate counts on both the EUR/USD and USD/CHF (Which are not as clear as the charts presented above)