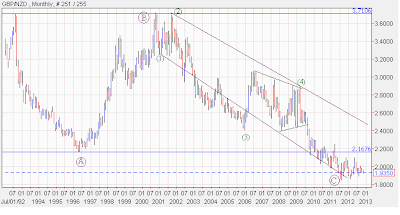
Looking at this chart that dates back to the early 90's it seems evident that this currency pair experienced a flat correction to the downside. Unfortunately I dont have the data going back further which means the begining of the wave A(circle) to the downside can be something else. What we are certain of however is that the move that kicked off in the year 2000 has clearly unfolded into 5 waves down off the high wave 3 being 2.618 of wave 1 and wave 5 ending slightly bellow the thrust measurment . The picture bellow shows a more detailed look at the 5 wave decline off the 2000.
The decline was a textbook impulse wave to the downside, the 4th wave unfolded into a running contracting triangle which signals to us that the following move to the downside is the last wave of the sequence and the move to follow would typically make it back to its terminus considering the guideline that states corrections usually end by the terminus of the previous fourth. Thats ofcourse IF the upcoming move is a correction. Also notice the divergence seen on the RSI 14 indicator. also notice the unfolding head and shoulders pattern as visible on the chart. Another point to note is the double bottom that formed on this chart as well. As of now this idea remains a possibility however it would become more probable if the standard chart patterns talked about above give way.
Regards,
Ahmed Farghaly


No comments:
Post a Comment