Wednesday, June 27, 2012

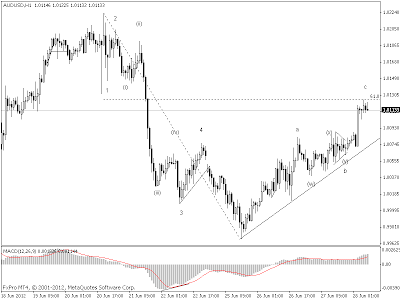
AUD/USD: Time to short risk into next week?


From an Elliott wave perspective it seems evident that the AUDUSD is in the terminal stages of a correction to the upside that started 3 days ago. Confirmation of completion would be a breach of the trendline visible on the chart. Whats even more exciting is how lined up this is with a chart of the S&P Futures chart as visible bellow.


Strong resistance lays at 1330 basis the September contract.

Regards,
Ahmed Farghaly
Monday, June 25, 2012

Egyptian stock market fun (ESMF)


Bellow is a more detailed look at the supercycle correction (basis the EGX70) that started in 2008. Please view the other post labelled "Egyptian stock market BUY BUY BUY!!!" Which looks at other Egyptian indexes from a wave perspective as well.


The absolute beauty of the wave principle.

This is what I posted to a few fellow traders and friends and hour before the open.

"This is the less widely followed EGX70, The EGX30 has bottomed in december 2011 and has not confirmed the new lows made this year by the EGX70 as expected. The Egyptian market gentlemen is setting stage for a strong rally despite the global risk off mode. The Egyptian economy is going to experience 'catch up' growth as did many of the economies in the emerging markets.


Regards,
Ahmed Farghaly


P.S. Confirmation would be a close above 440 (aggressive) A close above 530 ( conservative) on this index. Stop Bellow the low that is forming/has formed."

This index is up over 6% today, and this is a broad index, comprised of 70 stocks (rather than the EGX 30 [Main egypt index] which is comprised of only 30 stocks [which didn't confirm the 2012 lows to all the dow theorists our there [Dow theory signal buy signal would be established by a break of the 2012 highs on both the indexes stated above]). Other Egyptian indexes are up 8 and 7 %.

Now socionomically speaking we know that wars/ civil wars (or revolutions) occur towards the end of bear markets of primary degree or larger. Infact according to the teachings of Robert Prechter. the 12 month (annual) ROC on various indexes reached extreme negative values. In fact on the CMA general index it reached -81% in Dec 2011 which was even a greater extreme than the readings seen in 1932 in supercycle wave (IV) on the Dow Jones Industrials, this analagy suggests that the lows formed/forming are atleast of supercycle degree.


Only the wave principle can make you look at the markets in this way and in that great a detail.

Regards,
Ahmed Farghaly